Space blobs ! They're like regular blobs, except... they're from space...
I continue my long-standing policy of blogging every paper I'm involved with, but this latest one poses more of a challenge than most. In general, we try and write papers that focus on the science. Of course, you can't do science unless you've got something to do science on. In my case, this usually means finding the atomic hydrogen gas* component of galaxies. This is a subject about which I've gone on rants ad nauseum, albeit usually with lots and lots of pretty pictures.
* Most gifs in that post are broken, because Google FRICKIN SUCK at maintaining gifs for some reason. They're uploaded files, for heaven's sake, they shouldn't just stop working.
This post has to be a bit different. In this new paper, the balance is more towards, "look at all this lovely data" and away from" "here's what we learned from it". Let me explain why.
The main survey I get to play with is the Arecibo Galaxy Environment Survey, which looks at 16 different fields on the sky, each looking at different galaxy environments. In the field described in the latest paper, we found... rather a lot of detections, over 450 in fact. Only one other field so far contains more, and we haven't done much with that one because it was far too scary.
 |
| Yes, exactly like sorting a big pile of clothes, except the clothes are galaxies, and if you put them in the wrong piles, a referee will shout at you. This analogy definitely works. |
This large number means that doing an in-depth examination of such a complex field is just a right pain in the backside. And there's another, more pragmatic reason : it's not quite "publish or perish" for grant reporting purposes, but number of publications is a factor. So we could wait five years and get a bunch of papers all at once, or do one now and go from there. And lead author Boris Deshev was funded by a grant which was expiring. So we chose/were forced into the latter approach.
But actually this might be the better option. Science is not just a process of hypothesis-testing but of open-ended exploration and discovery. In fact that's one of the big advantages of AGES, that it has these regions we deliberately target but also a huge amount of foreground and background where we have no idea at all what we might find. That's where the excitement is. The downside, of course is that it's much harder to formulate a specific goal when you have no expectations. Sometimes you'll be lucky and a clear result will jump out at you, but often it's not easy to know what questions to ask. So it can be better to just say to the community, "look, here's the data, see what you can make of this."
Now you might be wondering if 450 sources is really such a large number. When you see the data, you'll probably understand why : even extracting those signals is a challenge, then we have to measure them, compare them with existing measurements, cross-correlate them with other catalogues, and then try and work out sensible ways to arrange the data so that we can squeeze valid result from it. It's not really 450, it's many thousands of different measurements and comparisons. Creating a sensible framework to organise everything isn't easy.
And samples of this size have their own challenges : they're small enough that every value matters, as even a few weird outliers can skew the trends (whereas with big data they'd get washed out) but large enough that taking minute care with every galaxy becomes burdensome.
Wait, what about the space blobs ?
Oh, sorry, I got a bit ahead of myself. Perhaps I should give some background overview of the science and the survey. If you're already familiar, skip ahead for the latest results.
Introduction
What's all this about hydrogen then ?
A good place to start, as atomic hydrogen is just about the simplest substance there is. One electron orbits one proton. We usually call it "HI" (H one) by convention. You can also have molecular hydrogen (H2, H two), which is two hydrogen atoms stuck together, or ionised hydrogen (HII, confusingly also pronounced as H two) which is just one proton. Or even maybe hydride (H-), but that one need not concern us further today because it's useless.
 |
| Hydrogen in general is the most common stuff in the Universe. All stars are ultimately made from hydrogen, but the steps to get there are complicated and involve some or all of its different versions. |
HI is the most common variant of hydrogen. We think of it as the reservoir of fuel for star formation : this is where it all comes from initially. But it's pretty toasty, typically hanging out at around 10,000 K*. It cools very slowly, and this high temperature means it has extreme difficulty getting dense enough to collapse into stars : the temperature keeps pushing back. Once it does get sufficiently dense, however, it can cool to form much denser H2 (typically ~100 K), which doesn't have the temperature to resist a runaway gravitational collapse, leading ultimately to star formation. Stars in turn inject energy into the surviving gas, ionising it to produce hot HII, which can slowly cool to HI, and so on.
* No intuitive feeling for how hot this is ? No matter. Just wait a few years and let global warming sort it all out.
Sometimes we say that HI is like a galaxy's fuel tank, and it's an interesting question how far this analogy can be pushed. With a car, you can still do 70 mph even if your tank is one-quarter full, but you'll stop pretty quickly when you reach empty. Likewise with a galaxy, perhaps. If the HI is in the tank, it's the molecular gas which is in the engine. So losing even a considerable fraction of HI doesn't necessarily mean you directly affect the star formation rate. The relationship status for HI and star formation is very much set to "it's complicated."
In terms of hydrogen, a typical galaxy looks like this : a big halo of very low density gas, within which lies the main disc of HI. The density of the HI rises towards the inner regions, where it flattens and you get a mixture of HI, HII, and stars.
 |
| Physically, the dense disc has the same thickness ratio as a CD. The larger HI disc is only a little bit thicker, while the halo is spherical. |
So how do you find all this gas then ?
It depends what you're looking for. The hottest gas (~1,000,000 K) emits at X-rays*, which needs space telescopes, while HII can be seen using ordinary optical telescopes. H2 is hard to see directly but there are ways of tracing it using other elements, often at mm wavelengths. HI is comparatively simple. Very helpfully, it spontaneously sends out radio waves of 21cm wavelength, so all you need is a radio telescope. You can detect it directly and it's super simple to convert between measured brightness and physical mass.
* This is ionised, but not usually referred to as HII. As I understand it, HII is used somewhat interchangeably with the recombination lines that are used to detect it. For this to happen the gas has to be only just above the temperature where ionisation happens. Too hot, as in X-ray emitting gas, and no recombination happens so you can't detect it at optical wavelengths.
The good thing is that the required radio telescopes are not too difficult to make. They don't need especially complex electronics or other equipment, they just need to be - and this is the downside - friggin' massive.
 |
| "It's what you do with it that counts !" said no astronomer ever. Well, not really, but sometimes bigger really is better. |
Once you've got the data, you go through it by eye looking for the signals, something I've covered before. And in our data the galaxies aren't well resolved, so they all look like blobs. In this case, lots of blobs.
Ahh, I see. And galaxy environments ?
Nothing to do with saving the rainforest or tying oneself to trains. Rather, galaxies don't all live in the same places. Some live in very sparse voids where there's not much of anything. Others live in little groups of a few other galaxies orbiting each other, while others live in massive, rich clusters thousands strong. And on the largest of scales, groups and clusters alike are mostly found in giant filaments.
Most galaxies live in small groups, with probably only ~1-2% in rich clusters. This means we have to be very careful with drawing general conclusions about galaxy evolution from such extreme locations, but they do let us sample huge numbers of galaxies with only a small amount of observing time.
Does gas vary with environment ?
Indeed. Remember that the HI is generally more extended than the stellar disc of a galaxy. This means it's less tightly bound, so any process which disturbs the galaxy (like other galaxies passing by, cruelty to animals, people who wear socks with sandals... that sort of thing) has more of an effect of the gas than the stars. So by looking at the gas, we can get a better idea of what the different environments really do.
AGES was designed to cover the whole range of galaxy environments, from voids to isolated galaxies to small groups and giant clusters. But each of our target regions also covers what's in front and behind of its target as well, so we get an awful lot of bonus data. This "AGES volume" is actually where most of our detections are found. And that, more than the target cluster, is what we started with in this paper.
AGES XI : The Franchise Continues
We're not going to let a little thing like the collapse of the telescope stop us, are we ? Of course not. In this paper we look at the Abell 1367 cluster. It's not a sexy, famous cluster like Virgo or Coma, but like all clusters, there's plenty of interesting stuff going on here. In fact it contains one of my favourite objects of all, the appalling-named "blue infalling group" :
 |
| The brightest blobs are galaxies, with the faint trails between them being ionised gas. Image from this paper. |
It always makes me think of the smoke trail from a bumblebee with its bum on fire. What's actually going on, we think, is that a group of galaxies are orbiting each other while also falling into the cluster proper. As they enter, ram pressure stripping removes their gas, which traces out these nice helical patterns. Try turning on a hosepipe and waving it around and you'll see what I mean, and possibly soak the neighbours too. Don't worry, it's very hot, so they'll definitely thank you.
 |
| Or, the internet bizarrely lacking adequate hosepipe gifs, you can use ropes, but that's not as much fun. |
Add in this particularly weird hot gas cloud and some very long HI tails and the cluster begins to seem like a place worth studying. Actually, the very first paper I was on (my role was pretty much 100% doing observations) was looking at the earlier AGES data of this region, which covered the central 5x1 degree strip. This covered the main part of the cluster but not much else. Interestingly, we saw that the galaxies detected in HI didn't follow the general pattern of galaxies detected through more familiar visible-light surveys. In 3D space they're distributed like so :
 |
| Galaxies detected with gas are in black, while those without are in red. |
What's going on here ? All the optically detected galaxies are in a neat line ! This is the finger-of-god effect. But look at the axes : we have velocity, not distance. Now as a proxy for distance, velocity (which is much easier to measure) works pretty well in general. This is Hubble's famous law, that there's a neat, linear relation between the two. But though this works just fine in most places, this isn't true in massive clusters*. Here the great mass of the cluster means that galaxies are moving much faster than in the general field, even though they're all actually at the same distance.
* In fact, as early as 1932, Fritz Zwicky found that cluster galaxies don't follow Hubble's Law - which constitutes some of the earliest evidence for dark matter.
Okay, so the optical galaxies look like a "finger" because we've measured their velocity and not true distance. If we could measure distance, we'd probably find they were all much more bunched-up here.
 |
| From another, much larger, survey. On the left, velocity is used for distance, hence all the fingery "streaks". On the right "true" distance is used, or at least a better approximation of it. No streaks ! |
But the HI detections don't show this behaviour. They seem to be found all over place, as though the cluster hadn't made any difference. Why not ? Are gas-rich galaxies like honey badgers and just don't care ? Nothing so exciting I'm afraid; it's just a selection effect.
Galaxies in the centres of clusters can easily lose all their gas as the clusters' own hot gas pushes it out and ionises it. At this distance (92 Mpc, 300 million light years) even a slight loss of the HI would make it undetectable. So we can only detect galaxies which haven't been much affected by the cluster - our detections are likely either just on the outskirts and entering it for the very first time, or not quite at the same distance after all.
Does this mean there's no point in our survey ? Is even the mighty Arecibo inadequate to the task of detecting gassy cluster galaxies ? This is too pessimistic. Rather, we can still detect galaxies just entering the cluster, and that's important. Understanding whether galaxy evolution is dominated by clusters or if they can have equally thrilling adventures elsewhere is controversial. The Blue Infalling Group is a nice example, but doesn't by itself prove that this so-called "pre-processing" is very important in the grand scheme of things.
What did we find this time ?
Space blobs
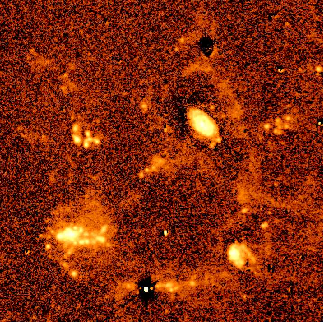
Well, now the survey is complete we have the full 5x4 degrees of coverage, so we can look in much more detail at those galaxies on the cluster outskirts. But first, here's what all those blobs actually look like in the original data.
 |
| Not my prettiest picture, to be sure... but you can play with this interactively online, which is quite fun. Might take a minute or two to load. |
I told you going from the data to a catalogue wasn't easy ! We use a combination of manually looking at the data and automatic source-finding algorithms to turn a bunch of blobs into a list of carefully-measured galaxies. In this case, because the galaxies are preferentially found over narrow velocity ranges, a lot of detections are confused with each other and hard to disentangle. Cataloguing involves a great deal of careful work to differentiate between galaxies as best we can, and flagging those where it's just an ugly unsalvageable mess. And large swathes of the data are dominated by whacking great big blobs, which are not alien megastructures but the effect of interference (yes, sometimes the hunt for aliens really does turn into a hunt for washing machines and other annoying electronic equipment).
This picture of the blobs is in the raw pixel coordinates of the data. When we convert everything to proper physical units, we see our our detections have quite a different distribution to the first paper :
 |
| Left : original, as above. Centre : only the HI detections in the original survey area (a few more are present now thanks to improved cataloguing). Right : the HI detections from the complete survey, over the region corresponding to the cluster (the full velocity range of the data is -2,000 -> +20,000 km/s). |
It seems that there's a large group close to the main cluster which is rather gas rich, compared to the cluster itself which you'd never guess was there from the HI data alone. You can play with a 3D version of this here.
Silent but deadly : galaxies have gas we can't detect
So the environment of the cluster itself is different to what we thought. Boris has a thing against treating clusters as spherical systems, because they generally aren't. Often we see them still assembling, sometimes along filaments. Alas, the techniques used previously didn't really show much in this case - there's no evidence that galaxies experiencing anything particularly location-specific here. We were hoping that maybe we'd some clear signs that the environment varied : maybe the ones in that group would be especially gas rich, maybe the ones nearest the cluster would be gas poor, but actually no, not really.
Which is not to say that the cluster doesn't do anything. On the contrary, it's annoyingly effective at gas removal. For comparison, in the much closer Virgo cluster, we could detect galaxies with only 10% or even 1% of the gas content of similar galaxies found elsewhere. But here, as soon as galaxies lose even quite a small fraction (say 50%) of their gas, they become undetectable. And this means we can't properly comment on exactly where or which structures galaxies in the cluster are losing gas, because we just can't find the gas-poor galaxies.
But it does enable a neat trick. In Virgo, we tried to "stack" the non-detected galaxies (adding their signals together) to increase our sensitivity. Which it did, by a factor 10... but no detection resulted. At the closer distance of Virgo, AGES is sensitive enough that it can detect the faintest whiff of gas*, so if it's not detected straight away, chances are it doesn't have any gas at all. Not so in A1367. Here, stacking results in a lovely clear detection :
* Do your own joke.
 |
| Stacking three different parts of the data set. As a sanity check, the blue curves show what happens when we stack galaxies we already detected - we always get a nice clear signal. The red curves show the stacked non-detections : we get a signal (a big bump) in the cluster and background, but not the foreground. The grey is a control stack where no galaxies are expected to be present. |
Does this point to a difference between the clusters ? Probably not. More likely, our stacked sample does include some galaxies which are totally gasless, but it also includes plenty which are only slightly gas-deficient : the sort we could detect directly in Virgo, but can't here because of the greater distance. The two clusters may or may not be more effective in gas removal, but we honestly just can't tell.
In short, in Virgo we'd already detected all the galaxies with even small amounts of gas. Stacking the rest didn't help because they'd lost the whole lot. Here, we can't tell which ones still have most of their gas, so we're stacking some which have no gas at all along with others which actually still have quite a lot left. Likewise in the foreground region here : at lower distances we're back to the same situation as Virgo... if we don't directly detect a galaxy here, it probably has no gas at all, so stacking doesn't do anything.
Is there a best way to measure gas loss ?
Getting this paper through the reviewing process was unfortunately another unnecessarily tiring exercise. Some of the comments were extremely valuable, but some smacked of the referee trying to write the paper for us, and other comments were honestly just wrong (somewhat amusingly, citing papers which actually claimed the exact opposite of what they said they did). And we made mistakes too, which made the experience about as much fun as wrestling a blindfolded bear while blindfolded ourselves.

What we did show, I think (though this one had to be heavily toned-down to make it palatable to the referee), was that we can use a simple statistical parameter to understand the effects of gas loss. Traditionally, we quantify how much gas a galaxy in a group or cluster has lost by comparing it with a control sample of similar galaxies in isolation. This "HI deficiency" can be computed for individual galaxies. It isn't at all exact though, because there's a lot of intrinsic variation in this parameter. Realistically, it can only tell you if a galaxy has :
- A lot more gas than expected (very rare !)
- A bit more gas than expected
- About as much gas as expected
- A bit less gas than expected
- A lot less gas than expected
And that's it. You can measure it as precisely as you like, but you if pretend this precision is actually meaningful, you're fooling yourself. Still, it can be done on a galaxy-by-galaxy basis, which is very useful.
But with a sample like this it doesn't really tell us very much. As we've seen, even a slight gas loss makes the galaxies undetectable. We can compute a lower limit on the deficiency, but this is misleading, as the galaxies could easily have lost a lot more than that.
A better approach might be to just calculate the fraction of galaxies detected in HI. This can only be done on a whole population, so we lose all the individual information. And the choice of which population to select is arbitrary. But, for example, we can say that the detected fraction varies radially, being lowest in the centre (the main cluster) and highest in the outskirts (the first infallers). And because it's just a fraction, it doesn't give any impression of the gas loss being any particular amount, just that some has happened. Which is sometimes all you really need.
Now the referee got a bit over-zealous here. We did not say, at any point, that the detection fraction was a better parameter than deficiency, nor did we even ever give that impression (a better approach is not the same thing at all !). It's better in some ways, in some circumstances, but the converse is equally true. In fact the deficiency is always preferable whenever you can use it, but the detected fraction is simpler and always available (though it becomes meaningless if your sample is small).
Brief intermission in which I rant against referees

And now back to our feature presentation
Fortunately, what did survive the referee's onslaught (and I have to say was improved by it) was a comparison between deficiency and fraction as a function of local and global density :

Wait ! Don't run away ! It looks a bit scary, and it is a complex plot. So let's break it down into manageable chunks. First, the data is divided into two samples which we refer to as the global density : those in the velocity range of the cluster, and those elsewhere. The latter are largely in low-density regions, mainly groups in filaments. The former include galaxies in the cluster outskirts as well as deep in the interior. In the upper section we plot trends using deficiency while on the lower panel we use the non-detected fraction.
Let's forget about that nasty plot for a moment and just look at the first two panels. These are the most important anyway.

What we're plotting here is how the deficiency and non-detected fraction vary as a function of local density : that is, how many galaxies are present in different spatial bins. In an earlier version of the paper, we made a mistake and found that local density made absolutely no difference and that it was due entirely to global density (cluster or non-cluster). But when we corrected that, we found the opposite : there's a nice trend with local density, and clusters are only different because the local density is generally higher there. This fits with our other recent findings too.
(That we were able to spin some quite elaborate but plausible-sounding justifications for the first (wrong) interpretation I take as an important lesson in the dangers of rationalising. Again, no one paper should be held as anything more than evidence, never as proof.)
We can see from the plot that this result is much clearer with the non-detected fraction than with deficiency. The referee was concerned that this might be a statistical effect rather than representing real physics : yes, there's a clear trend, but maybe this is only because galaxies vary in some other way with local density. So to exactly reverse my previous rant, we wouldn't have looked at this without the referee's diligent nit-picking. Thank you, kindly pedantic stranger !
This is where the other panels come in : plotting deficiency/fraction as functions of stellar mass and star formation rate. We also took great pains to ensure that, unlike previous claims, we used a properly complete sample for this area, meaning that we're comparing like-for-like, something the referee seemed not to really believe for some reason.
What do we find ? Something like this :
- Overall, for all parameters, both deficiency and non-detected fraction are higher for cluster galaxies than for non-cluster galaxies. That's a good sanity check : there's definitely gas loss in the cluster, as we'd expect.
- There's little or no variation with gas loss (by either parameter) as a function of stellar mass. So our trends in gas loss aren't being driven by selectively detecting smaller or larger galaxies. This is important, because we'd only be able to detect high deficiencies for the biggest galaxies; likewise, we wouldn't expect to detect small galaxies unless they were actually gas rich.
- There's not much trend in deficiency with star formation rate. This might be a bit more surprising, but remember the fuel tank analogy : the relation between HI and star formation is indirect. But it could also be something simpler, since the error bars here are very large.
- In contrast, there's a clear trend between fraction and star formation rate. Here the error bars are much smaller. So tentatively, it looks like the large errors on deficiency are masking the trend : less gas, less stars. The detected fraction might be offering us more information in this case, at the cost of knowing which particular galaxies have lost gas.
Conclusions and where we go next
There are three main outcomes from this paper. First is the catalogue itself, together with an "atlas" : a set of visual charts for each galaxy, including the HI spectra and maps and the corresponding optical images, all labelled with the known galaxies present. Hopefully we can use this retroactively on our other data, looking towards the time when we release the full AGES data set for the whole survey.
Second, stacking galaxies works in this field. Having spent feckin' ages trying this during my PhD (there's a subheading in one chapter, "Four hundred million non-detections"), I was despondent that it would ever work at all. But it very clearly does, opening up scope for utilising this elsewhere. Boris has some intriguing ideas about what we might do with this.
Third, detected fraction can offer a viable alternative to HI deficiency. Despite the referee's protestations I think this could indeed be more useful at larger distances (where it seems galaxies were considerably more gas rich). Note that you don't get something for nothing - you get significantly reduced errors, but only because this has to be applied to galaxies en masse; individual information is lost. Fully understanding this parameter is more subtle than it may first appear, and needs a lot of work to ensure it is indeed telling us what we think it's telling us. It is absolutely legitimate that one can still have reservations about this. We think it's at the point where it deserves wider attention, but no more than this.
And scientifically, the view that it's local density which drives gas loss is an interesting one. It's not what one would naively expect. In massive clusters, gas loss is mainly due to ram pressure stripping, whereas in small groups it's from tidal encounters. These two processes scale completely differently, but we're seeing a smooth change in gas loss as a function of density. And in our previous study, we found that there's a smooth change with ram pressure as well, extending down even to very low pressures indeed.
This is a bit strange. It's a bit like saying that the fastest horse is always the biggest one : surely, you wouldn't expect a shire horse to come top of the league. You expect a broad correlation (Shetland ponies can't compete with a thoroughbred), but not a nice, simple, continuous trend.
It's hard to say what might be going on. My guess is the data isn't precise enough, that we're smoothing out any more sudden changes because the error bars are quite large : the change isn't really as continuous as it looks. I am not sure if this is a matter of getting better data or analysing the data in different ways to reveal if there really is any qualitative difference between small groups of massive clusters... then again, maybe the counteracting effects cancel out and the smooth change is correct after all. It's possible.
What next ? Well, some of our galaxies have no optical counterparts, for which we have follow-up observations using the Chinese FAST telescope. If any of these are detected that's an automatically interesting result. And of course, we can dig down deeper into the data to study the cluster itself in much more detail, as well as other individual objects with HI streams, galaxies with low star formation rates but high gas contents and other weird oddballs.... a veritable host of things ! As I said, defining the problem is likely to be the hardest part. But now we have a basic catalogue to start from, making comparisons and looking for trends gets a whole lot easier.
And all this from a bunch of blobs.