| Tycho Brahe learned this lesson the hard way, losing in nose in a duel about an equation. |
* Colours in all of the following images are false, because to see neutral hydrogen we'd need enormous eyes made of metal. The structures the colours represent are absolutely real.
Two-dimensional images taken at roughly the same wavelengths of light that we can see are one thing, but visualising 3D data is another challenge altogether. I've previously managed this reasonably well, I think, for certain cases. The basic method is incredibly simple : chop up the data into lots of slices, and make an image of each slice. Then you just line up all the image slices and you get a very convincing illusion that you're looking at a whole volume of data (each slice has to be slightly transparent, of course).
This actually works pretty well for most hydrogen observations of distant galaxies. For these, the observations generally only span a small part of the sky, so the data forms something which is roughly cube-shaped. The only major complication is that while we can map the hydrogen on the sky, the third axis is not distance, but velocity. On very large scales, this turns out to be a good approximation to distance. But not on the scale of a single galaxy. Here the velocity information tells you about the rotation of a galaxy and nothing about how distant individual parts of it are.
That doesn't really matter too much, though, because it's still useful to view the data in 3D. And prettier too, otherwise there'd be no point in bothering.
Ironically, things get more difficult with our own, much closer galaxy. We can see things in much greater detail and with quadrillions of times more sensitivity, over the entire sky. The sensitivity brings me to the first problem - the "dynamic range" of the data. All this means is that there's a massive difference between the faintest and brightest emission we can detect. The contrast between the faint and bright parts of the image also varies with velocity. So, for instance, in some parts of the data volume you might have a single small bright structure, whereas in others you'll have huge complicated things but all at about the same brightness.
The above shows the view moving through part of the the hydrogen detected in the Milky Way by the GALFA-HI survey. Someone - I believe it was Josh Peek - came up with the genius idea of generating colour by using different slices. So one slice will be coloured red, the next green and the next blue.
If you use parts of the cube that are too far apart, you get a meaningless mess, because the structures in different parts of the volume are very different. But if you use adjacent (or nearly so) slices, the structures are similar but not identical - and the effect is to create a really quite wonderful lightshow. That's fine for 2D images and animations. In 3D, however, all of those glorious colours wash each other out and you get a sort of big browny-coloured fuzzy blob.
 |
| Leiden / Argentine / Bonn all-sky data. |
With other galaxies, a large part of the data is actually just noise. This is easy to remove, leaving only the relatively small important data. Not so with our own galaxy. Here, all of the data is important. And some parts, as I've said, are very bright, which can overwhelm the faint structures. So how do you see the full 3D complexity of the data ? And how do you preserve the glorious technicolour of the 2D images ?
One nice trick is to allow the colour of each slice of the data to vary according to the range of data values in each slice. What this means is that the contrast between bright and faint structures will always be the same, even if the faintest emission in one slice of the data is brighter than the strongest emission in other slices.
The second important trick is to have colour and transparency vary differently. You need to be able to see which parts of the data are really bright, but you don't want them to block the view of the fainter features. If you want to get really fancy, you can have the colours vary logarithmically. That means that something has to actually be, say, 10 times brighter before it will appear to be twice as bright. The upshot is that both faint and bright features become visible.
Enough talk. Here's what the above GALFA data set looks like in 3D, with the correct settings :
But that's only part of the problem. Most extragalactic data only covers a small part of the sky. GALFA data covers 13,000 square degrees, but over a relatively narrow portion of the sky. Pretending the data is actually a cuboid doesn't really make much difference - like peeling a narrow strip of the skin from an orange, you won't cause much distortion by flattening it.
But other HI surveys cover the entire sky. If you try and pretend the whole, spherical sky is actually cube-shaped, you get something that looks kinda cool, but also pretty weird and difficult to interpret :
 |
| The entire sky from the Leiden / Argentine / Bonn survey. |
Unfortunately, this is really boring. A much better approach is to keep the sphere and render a rotating GIF of it, because the internet freakin' loves GIFs :
But then of course, you can't see how the structures vary in velocity. The simplest method is to animate the texture on the sphere so that you see different slices of the data - just like before, with the flat images, but this time wrapped to a sphere. This works, and it looks lovely. I think this may be my favourite gif :
This doesn't help at all with the problem of viewing the data in 3D, of course. The solution to that is to make hundreds of nested spheres, each one with a map of the hydrogen at a different velocity channel. And then you get something which looks... well, a bit weird, really.
The center of this bizarre-looking thing looks even more spectacular :
And here's the resulting obligatory movie :
So why did the galaxy turn into an iridescent butterfly ? The moire patterning is due to the limited resolution of the survey - there are, in a sense, only so many angles the telescope can point at. Transforming this into distance creates long blank streaks where (effectively) the telescope didn't look.
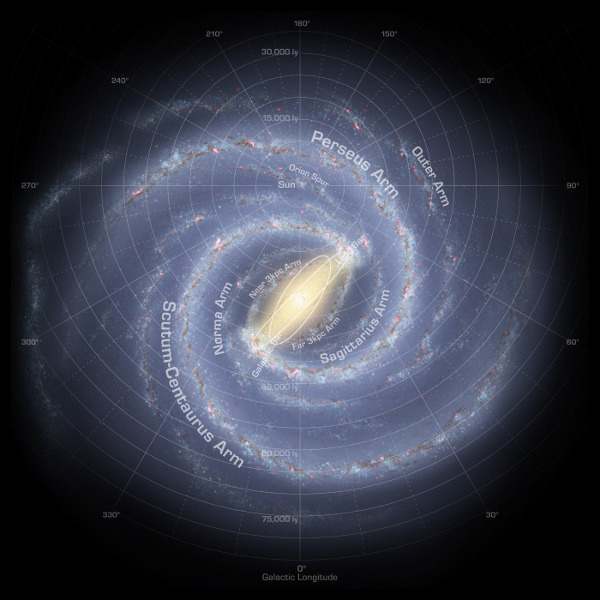
More serious problems occur because looking directly towards or away from the galactic center, we can't measure the velocity of the gas at all. That's because we can only measure how fast the gas is moving toward or away from us, and at these particular angles, it isn't. It's only moving across the sky, which we can't measure. Another weird effect is that for any point closer to the center of the galaxy than the Sun, the equations produce two (yes, TWO !) possible distances for the gas, and there's no easy way to find out which is the right one. That's what causes the weird bubble-like structure in the center.
Ironically then, it really is easier to see the structure of external galaxies than the one we live in. But all is not lost. Further away from the center than the Sun, and avoiding looking directly toward or away from the center, the measurments are pretty good. When the parts where measurements become meaningless are removed (well mostly), things look quite a bit better. It's even just about possible to see that the galaxy has spiral arms.
Hardcore enthusiasts - who have somehow read this entire thing - should go and get a cup of tea, and then take a look at Kevin Jardine's extraordinarily awesome Galaxy Map - especially the mapping hydrogen and velocity pages. All I really wanted to do was make pretty pictures, but the (arguably) more important business of mapping the galaxy has to use other techniques to fill in the gaps. But don't worry - this post is almost over, so I'll skip ahead to the end result.
 |
| Credit : GalaxyMap.org |
What's that ? You'd like this post in video form, with narration by an angry Scotsman ? No problem !


Next challenge... make a video that will work in 3D on my tv. Most tv programs work using side-by-side mode i.e., its two pictures next to each other that the tv then splits down the middle
ReplyDeleteIf you just need a video which consists of two side-by-side views, that would be really simple to do. It would double the rendering time, but I'll just leave my fancy works machine running overnight. :)
Delete